5 Expectation
Reference: Chapter 5. Resnick (2005).
The expectation represents a central value of a random variable and has a measure-theoretic counterpart as a Lebesgue-Stieltjes integral of \(X\) with respect to a (probability) measure \(\mathbb{P}\). This kind of integration is defined in steps. First, integration of simple functions is shown and then extended to more general random variables.
Let’s define a probability space \((\Omega, \mathcal{B}, \mathbb{P})\) and a generic random variable \(X\) such that \[ X: (\Omega, \mathcal{B}) \longrightarrow (\bar{\mathbb{R}}, \mathcal{B}(\bar{\mathbb{R}})) \text{,} \] where \(\bar{\mathbb{R}} = [-\infty, \infty]\). Then, the expectation of \(X\) is denoted as: \[ \mathbb{E}\{X\} = \int_{\Omega} X d\mathbb{P} = \int_{\Omega} X(\omega) \mathbb{P}(d\omega) \text{,} \] as the Lebesgue-Stieltjes integral of \(X\) with respect to the (probability) measure \(\mathbb{P}\).
5.1 Simple functions
Let’s start from the definition of the expectation for a restricted class of random variables called simple functions. Generally speaking, a random variable \(X(\omega)\) is called simple if it has a finite range.
Formally, let’s consider a probability space \((\Omega, \mathcal{B}, \mathbb{P})\) and a \(\mathcal{B}/\mathcal{B}(\mathbb{R})\)-measurable simple function \(X: \Omega \rightarrow \mathbb{R}\) defined as follows \[ X(\omega) = \sum_{i=1}^{n} a_i \mathbb{1}_{A_i}(\omega) \text{,} \tag{5.1}\] where \(a_i \in \mathbb{R}\) and \(A_i \in \mathcal{B}\) is a disjoint partition of the sample space, i.e. \({\color{red}{\bigsqcup}_{i=1}^{n}} A_i = \Omega\).
Let’s denote the set of all simple functions on \(\Omega\) as \(\mathcal{E}\). In this setting, \(\mathcal{E}\) is a vector space that satisfies three main properties.
Constant: given a simple function \(X \in \mathcal{E}\), then \(\alpha X \in \mathcal{E}\). In fact: \[ \begin{aligned} \alpha X & {} = \sum_{i=1}^{n} \alpha a_i \mathbb{1}_{A_i} = \sum_{i=1}^{n} a_i^{\ast} \mathbb{1}_{A_i} \in \mathcal{E} \end{aligned} \text{,} \tag{5.2}\] where \(a_i^{\ast} = \alpha a_i\).
Linearity: given two simple functions \(X, Y \in \mathcal{E}\), then \(X + Y \in \mathcal{E}\). In fact: \[ \begin{aligned} X + Y & {} = \sum_{i=1}^{n} a_i \mathbb{1}_{A_i} + \sum_{j=1}^{m} b_j \mathbb{1}_{B_j} = \\ & = \sum_{i=1}^{n} \sum_{j=1}^{m} (a_i + b_j) \mathbb{1}_{A_i} \mathbb{1}_{B_j} = \\ & = \sum_{i=1}^{n} \sum_{j=1}^{m} (a_i + b_j) \mathbb{1}_{A_i {\color{blue}{\cap}} B_j} \end{aligned} \tag{5.3}\] where the sequence of sets \(\{A_i B_j \; 1 \le i \le n \;\text{and}\; 1 \le j \le m \}\) form a disjoint partition of \(\Omega\).
Product: given two simple functions \(X, Y \in \mathcal{E}\), then \(X Y \in \mathcal{E}\). In fact: \[ \begin{aligned} X Y & {} = \sum_{i=1}^{n} a_i \mathbb{1}_{A_i} \sum_{j=1}^{m} b_j \mathbb{1}_{B_j} = \\ & = \sum_{i=1}^{n} \sum_{j=1}^{m} (a_i b_j) \mathbb{1}_{A_i} \mathbb{1}_{B_j} = \\ & = \sum_{i=1}^{n} \sum_{j=1}^{m} (a_i b_j) \mathbb{1}_{A_i {\color{blue}{\cap}} B_j} \end{aligned} \tag{5.4}\]
5.1.1 Expectation of simple functions
The expectation of a simple function \(X\) is defined as: \[ \mathbb{E}\{X\} = \int_{\Omega} X d\mathbb{P} = \sum_{i=1}^{n} a_i \mathbb{P}(A_i) \text{,} \tag{5.5}\] where \(|a_i| < \infty\).
Expectation of an indicator function: we have that \[ \mathbb{E}\{\mathbb{1}_A(\omega)\} = \mathbb{P}(X(\omega) \in A) = \mathbb{P}(A) \]
Non-negativity: If \(X \ge 0\) and \(X \in \mathcal{E}\) then \(\mathbb{E}\{X\} \ge 0\)
Linearity: the expectation of simple functions is linear, i.e. \[ \mathbb{E}\{\alpha X + \beta Y\} = \alpha \mathbb{E}\{X\} + \beta \mathbb{E}\{Y\} \text{.} \]
Monotonicity: the expectation of simple functions is monotone on \(\mathcal{E}\), in the sense that if two random variables \(X, Y \in \mathcal{E}\) are such that \(X \le Y\), then \[ \mathbb{E}\{X\} \le \mathbb{E}\{Y\} \text{.} \]
Continuity: the expectation of simple functions is continuous on \(\mathcal{E}\), in the sense that, if \(X_n, X \in \mathcal{E}\) and either \(X_n \downarrow X\) or \(X_n \uparrow X\), then \[ \mathbb{E}\{X_n\} \downarrow \mathbb{E}\{X\} \quad \mathbb{E}\{X_n\} \uparrow \mathbb{E}\{X\} \]
5.2 Extension of the definition
Simple functions are the building blocks in the definition of the expectation in terms of Lebesgue-Stieltjes integral. In fact a known theorem called Measurability theorem shows that any measurable function can be approximated by a sequence of simple functions.
Theorem 5.1 (Measurability theorem) Suppose that \(X(\omega) \ge 0\) for all \(\omega \in \Omega\). Then, \(X\) is \(\mathcal{B}/\mathcal{B}(\mathbb{R})\) measurable if and only if there exist simple functions \(X_n \in \mathcal{E}\) and \[ 0 \le X_n \uparrow X \iff X = \lim_{n\to\infty} \uparrow X_n \text{.} \]
5.2.1 Non-negative random variables
We now extend the definition of the expectation to a broader class of random variables. Let’s define the set \(\mathcal{E}_+\) as the set of non-negative simple functions and define: \[ \bar{\mathcal{E}}_+ = \{X \ge 0 : X: (\Omega, \mathcal{B}) \to (\bar{\mathbb{R}}, \mathcal{B}(\bar{\mathbb{R}})) \} \] to be the set of non-negative and measurable functions with domain \(\Omega\).
If \(\mathbb{P}(X = \infty) = 0\), then the expectation \(\mathbb{E}\{X\} < \infty\) and by Theorem 5.1 we can find an \(X_n \in \mathcal{E}_+\) such that \(0 \le X_n \uparrow X\). Since the expectation operator preserves monotonicity, also the sequence \(\mathbb{E}\{X_n\}\) is non-decreasing. Thus, since the limit of monotone sequences always exists, then \[ \mathbb{E}\{X\} = \lim_{n\to\infty}\mathbb{E}\{X_n\} \] thus extending the definition of expectation from \(\mathcal{E}\) to \(\bar{\mathcal{E}}_+\).
5.2.2 Integrable random variables
Finally, we extend the definition of expectation to all random variables such that \(\mathbb{E}\{X\} < \infty\). For any random variable \(X\), let’s call \[ X^+ = \max(X, 0) \quad X^- = \max(-X, 0) \] Therefore, \[ \begin{aligned} & {} X^+ = X && \text{if } X \ge 0 \\ & X^- = -X && \text{if } X \le 0 \end{aligned} \implies \begin{cases} & {} X^+\ge 0 \\ & X^- \ge 0 \end{cases} \] Then, we define a new random variable \[ |X| = X^+ + X^- \] that is \(\mathcal{B}\text{/}\mathcal{B}(\mathbb{R})\)-measurable if both \(X^+\) and \(X^-\) are measurable. If at least one among \(\mathbb{E}\{X^+\}\) or \(\mathbb{E}\{X^-\}\) is finite, then we define \[ \mathbb{E}\{X\} = \mathbb{E}\{X^+\} - \mathbb{E}\{X^-\} \] and we call \(X\) quasi integrable. Instead, if both \(\mathbb{E}\{X^+\} < \infty\) and \(\mathbb{E}\{X^-\} < \infty\), then \(\mathbb{E}\{|X|\}<\infty\) and we call \(X\) integrable. In this case, we write \(X \in \mathcal{L}_1\), where \(\mathcal{L}_1\) stands for the set of integrable random variables with first moment finite, i.e. \[ \mathcal{L}_1 = \{X: \Omega \to \mathbb{R} : X \text{ is a r.v. }, \mathbb{E}\{|X|\} < \infty \} \text{,} \tag{5.6}\] In general, writing \(X \in \mathcal{L}_p\), means that \(X\) belongs to the set of integrable random variables with finite \(p\)-th moment, i.e. \[ \mathcal{L}_p = \{X: \Omega \to \mathbb{R} : X \text{ is a r.v. }, \mathbb{E}\{|X|^p\} < \infty \} \text{.} \tag{5.7}\]
5.3 General definition
The expectation of a random variable \(X\) is its first moment, also called statistical average. In general, it is denoted as \(\mathbb{E}\{X\}\). Let’s consider a discrete random variable \(X\) with distribution function \(P(X = x_j)\). Then, the expectation of \(X\) is the weighted average between all the possible \(m\)-states that the random variable can assume, weighted by their respective probabilities of occurrence, i.e. \[ \mathbb{E}\{X\} = \sum_{j=1}^{m} x_j \cdot\mathbb{P}(X = x_j) \text{,} \] that is exactly Equation 5.5. In the continuous case, i.e. when \(X\) takes values in \(\mathbb{R}\) and admits a density function \(f_X\), the expectation is computed as an integral, i.e. \[ \mathbb{E}\{X\} = \int_{-\infty}^{\infty} x dF_{X} = \int_{-\infty}^{\infty} x f_{X}(x)dx \text{.} \]
Definition 5.1 (Moments and central moments) For any random variable \(X\), let’s define the moment of order \(p \ge 1\) as: \[ m_p = \mathbb{E}\{X^p\} \text{,} \tag{5.8}\] Similarly, for \(p \ge 2\) we define the central moment as \[ \mu_p = \mathbb{E}\{(X - m_1)^p\} \text{.} \tag{5.9}\]
5.3.1 Variance and Covariance
In general, the population variance of a random variable is defined as the second central moment (Equation 5.9): \[ \mathbb{V}\{X\} = \mathbb{E}\{\left(X - \mathbb{E}\{X\}\right)^2\} = \sigma^2 \text{.} \tag{5.10}\]
Let’s consider a discrete random variable \(X\) with distribution function \(P(X = x_j) = p_j\). Then the variance of \(X\) is the weighted average between all the possible \(m\) centered and squared states that the random variable can assume, weighted by their respective probabilities of occurrence, i.e. \[ \mathbb{V}\{X\} = \sum_{j=1}^{m} (x_j-\mathbb{E}\{X\})^2 p_j \text{.} \] In the continuous case, i.e. when \(X\) admits a density function and takes values in \(\mathbb{R}\), the expectation is computed as: \[ \mathbb{V}\{X\} = \int_{-\infty}^{\infty} (x - \mathbb{E}\{X\})^2 f_{X}(x)dx \text{.} \]
Let’s consider two random variables \(X\) and \(Y\). Then, in general their covariance is defined as: \[ \mathbb{C}v\{X,Y\} = \mathbb{E}\{\left(X - \mathbb{E}\{X\}\right)\left(Y - \mathbb{E}\{Y\}\right)\} = \sigma_{XY} \text{.} \tag{5.11}\]
In the discrete case where \(X\) and \(Y\) have a joint distribution \(\mathbb{P}(X = x_i, Y = y_j) = p_{ij}\), their covariance is defined as: \[ \mathbb{C}v\{X,Y\} = \sum_{i = 1}^{m} \sum_{j = 1}^{s} \left(x_i - \mathbb{E}\{X\}\right)\left(y_j - \mathbb{E}\{Y\}\right) p_{ij} \text{.} \] In the continuous case, if the joint distribution of \(X\) and \(Y\) admits a density function the covariance is computed as: \[ \mathbb{C}v\{X,Y\} = \int_{-\infty}^{\infty} \int_{-\infty}^{\infty} (x - \mathbb{E}\{X\})(y - \mathbb{E}\{Y\}) f_{X,Y}(x,y)dxdy \text{.} \]
Proposition 5.1 (Properties of the variance) There are several properties connected to the variance.
The variance can be computed in terms of the second and first moment of \(X\), i.e. \[ \mathbb{V}\{X\} = \mathbb{E}\{X^2\} - \mathbb{E}\{X\}^2 = \mu_2 - (\mu_1)^2 \text{.} \tag{5.12}\]
The variance is invariant with respect to the addition of a constant \(a\), i.e. \[ \mathbb{V}\{a + X\} = \mathbb{V}\{X\} \text{.} \tag{5.13}\]
The variance scales under multiplication by a constant \(a\), i.e. \[ \mathbb{V}\{aX\} = a^2\mathbb{V}\{X\} \text{.} \tag{5.14}\]
The variance of the sum of two correlated random variables is computed as: \[ \mathbb{V}\{X+Y\} = \mathbb{V}\{X\} + \mathbb{V}\{Y\} + 2\mathbb{C}v\{X,Y\} \text{.} \tag{5.15}\]
The covariance can be expressed as: \[ \mathbb{C}v\{X,Y\} = \mathbb{E}\{XY\} - \mathbb{E}\{X\}\mathbb{E}\{Y\} \text{.} \tag{5.16}\]
The covariance scales under multiplication by constants \(a\) and \(b\), i.e. \[ \mathbb{C}v\{aX,bY\} = ab\mathbb{C}\{X,Y\} \text{.} \tag{5.17}\]
5.3.2 Skewness
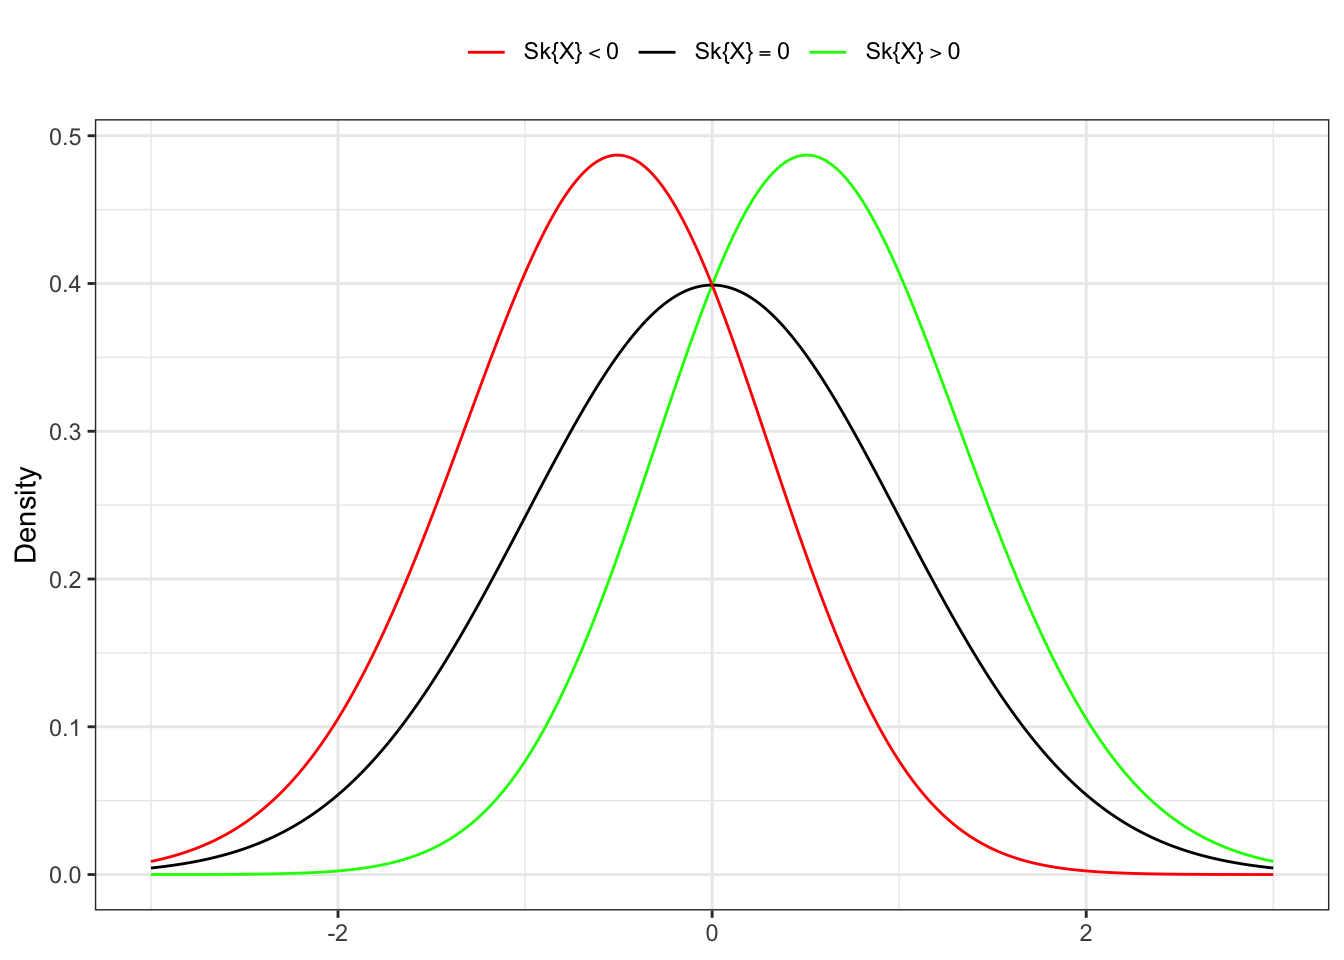
The skewness is a measure of the asymmetry of the probability distribution of a real-valued random variable about its mean. The skewness value can be positive, zero, negative, or undefined. For a unimodal distribution, negative skew commonly indicates that the tail is on the left side of the distribution, and positive skew indicates that the tail is on the right.
Following the same notation as in Ralph B. D’agostino and Jr. (1990), let’s define and denote the population skewness of a random variable \(X\) as: \[ \mathbb{S}k\{X\} = \beta_1(X) = \mathbb{E}\left\{\left(\frac{X - \mathbb{E}\{X\}}{\sqrt{\mathbb{V}\{X\}}}\right)^3\right\} = \frac{\mu_3}{\sigma^3} \text{,} \tag{5.18}\]
5.3.3 Kurtosis
The kurtosis is a measure of the tailedness of the probability distribution of a real-valued random variable. The standard measure of a distribution’s kurtosis, originating with Karl Pearson, is a scaled version of the fourth moment of the distribution. This number is related to the tails of the distribution. For this measure, higher kurtosis corresponds to greater extremity of deviations from the mean (or outliers). In general, it is common to compare the excess kurtosis of a distribution with respect to the normal distribution (with kurtosis equal to 3). It is possible to distinguish 3 cases:
- Negative excess kurtosis or platykurtic distributions produce fewer outliers than the normal distribution.
- Zero excess kurtosis or mesokurtic distributions produce the same number of outliers as the normal distribution.
- Positive excess kurtosis or leptokurtic distributions produce more outliers than the normal distribution.
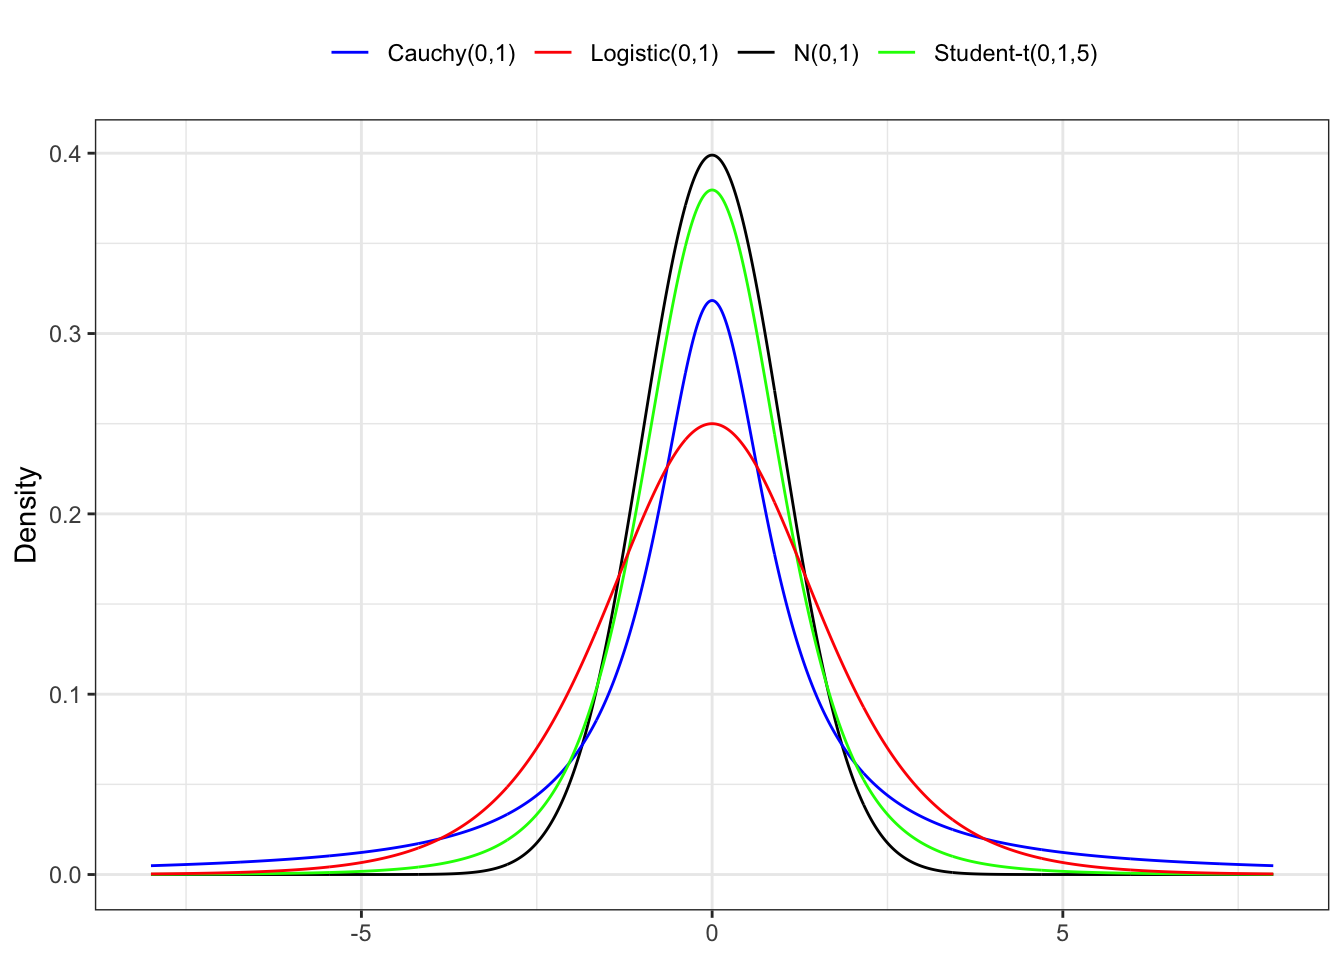
Let’s define and denote the kurtosis of a random variable \(X\) as: \[ \mathbb{K}t\{X\} = \beta_2(X) = \mathbb{E}\left\{\left(\frac{X - \mathbb{E}\{X\}}{\sqrt{\mathbb{V}\{X\}}}\right)^4\right\} = \frac{\mu_4}{\sigma^4} \text{,} \tag{5.19}\] or equivalently the excess kurtosis as \(\mathbb{K}t\{X\}-3\).
5.4 Review of inequalities
Definition 5.2 (Markov Inequality) Let’s consider a random variable \(X \in \mathcal{L}_1\) (Equation 5.6), then for all \(\lambda > 0\) the Markov’s inequality states that \[ \mathbb{P}(|X| \ge \lambda) \le \frac{\mathbb{E}\{|X|\}}{\lambda} \text{.} \] Hence, this inequality produces an upper bound for a certain tail probability \(1 - \mathbb{P}(|X| \le \lambda)\) by using only the first moment of \(X\).
Definition 5.3 (Chebyshev Inequality) Let’s consider a random variable \(X \in \mathcal{L}_2\) (Equation 5.7), i.e. with first and second moment finite \[ \mathbb{E}\{|X|\} < \infty, \quad \mathbb{E}\{X^2\} < \infty \text{,} \] then for all \(\lambda > 0\) Chebyshev’s inequality states that \[ \mathbb{P}(X \ge \lambda) \le \frac{1}{\lambda^2}\mathbb{E}\{X^2\} \text{.} \tag{5.20}\] As with Markov’s inequality, this one also produces an upper bound for a certain tail probability \(1 - \mathbb{P}(|X| \le \lambda)\), but by using only the second moment of \(X\).
Definition 5.4 (Modulus Inequality) Let’s consider \(X \in \mathcal{L}_1\) (Equation 5.6), then the modulus inequality states that: \[ |\mathbb{E}\{X\}| \le \mathbb{E}\{|X|\} \text{,} \]
Definition 5.5 (Holder Inequality) Let’s consider two numbers \(p\) and \(q\) such that \[ p > 1, q > 1, \; \frac{1}{p} + \frac{1}{q} = 1 \text{,} \] and let’s consider two random variables \(X\) and \(Y\) such that: \[ \mathbb{E}\{|X|^{p}\} < \infty, \quad \mathbb{E}\{|Y|^{q}\} < \infty \text{.} \] Then, \[ |\mathbb{E}\{XY\}| \le \mathbb{E}\{|XY|\} \le (\mathbb{E}\{|X|^p\})^{\frac{1}{p}} (\mathbb{E}\{|Y|^q\})^{\frac{1}{q}} \text{.} \tag{5.21}\]
Definition 5.6 (Schwartz Inequality) Consider two random variables \(X, Y \in \mathcal{L}_2\), i.e. with first and second moment finite, i.e. \[ \mathbb{E}\{|X|\} < \infty, \quad \mathbb{E}\{X^2\} < \infty \text{.} \] Then \[ |\mathbb{E}\{XY\}| \le \mathbb{E}\{|XY|\} \le \sqrt{\mathbb{E}\{X^2\}\mathbb{E}\{Y^2\}} \text{.} \tag{5.22}\] Note that this is a special case of Holder inequality (Equation 5.21) with \(p = q = 2\).
Definition 5.7 (Jensen Inequality) Let’s consider a convex function \(u: \mathbb{R} \to \mathbb{R}\). Suppose that \(\mathbb{E}\{X\} < \infty\) and \(\mathbb{E}\{|u(X)|\} < \infty\), then \[ \mathbb{E}\{u(X)\} \ge u(\mathbb{E}\{X\}) \text{,} \tag{5.23}\] if \(u\) is concave the result reverses, i.e. \[ \mathbb{E}\{u(X)\} \le u(\mathbb{E}\{X\}) \text{.} \tag{5.24}\]